As of March 31, 2025
Environment
Greenhouse Gas Emissions*
(t-CO2)
| Scope/Category | FY 2020 CO2 Emissions |
FY 2021 CO2 Emissions |
FY 2022 CO2 Emissions |
FY 2023 CO2 Emissions |
FY 2024 CO2 Emissions |
|
|---|---|---|---|---|---|---|
| Scope1 | 441.7 | 507.1 | 538.7 | 556.4 | 577.7 | |
| Scope2 | Location-based | 9,275.0 | 9,040.1 | 9,877.4 | 9,147.9 | 8,662.0 |
| Market-based | 8,899.4 | 8,713.1 | 8,897.2 | 7,778.5 | 7,623.9 | |
| Scope3 | 651,089.0 | 611,297.5 | 703,140.0 | 658,114.4 | 789,624.4 | |
| Category 1 | Purchased goods and services | 605,791.8 | 572,779.3 | 657,971.5 | 613,827.0 | 745,810.5 |
| Category 2 | Capital goods | 12,818.6 | 7,334.7 | 11,738.2 | 13,758.1 | 12,887.9 |
| Category 3 | Fuel and energy related activities not included in Scope 1 or 2 | 1,444.7 | 1,427.7 | 1,640.9 | 1,489.3 | 1,462.5 |
| Category 4 | Transportation and delivery (upstream) | 1,958.2 | 2,251.7 | 2,761.3 | 2,255.8 | 2,056.8 |
| Category 5 | Waste generated in operations | 499.7 | 614.5 | 554.5 | 634.9 | 822.9 |
| Category 6 | Business travel | 643.8 | 1,006.1 | 1,276.1 | 1,318.4 | 1,622.5 |
| Category 7 | Employee commuting | 2,486.3 | 1,884.2 | 2,661.0 | 2,400.1 | 2,321.8 |
| Category 8 | Leased assets (upstream) | No calculation target |
No calculation target |
No calculation target |
No calculation target |
No calculation target |
| Category 9 | Transportation and delivery (downstream) | No calculation target |
No calculation target |
No calculation target |
No calculation target |
No calculation target |
| Category 10 | Processing of sold products | No calculation target |
No calculation target |
No calculation target |
No calculation target |
No calculation target |
| Category 11 | Use of sold products | 25,385.6 | 23,948.0 | 24,487.8 | 22,382.3 | 22,595.0 |
| Category 12 | End-of-life treatment of sold products | 60.4 | 51.3 | 48.5 | 45.4 | 44.4 |
| Category 13 | Leased assets (downstream) | No calculation target |
No calculation target |
No calculation target |
No calculation target |
No calculation target |
| Category 14 | Franchises | No calculation target |
No calculation target |
No calculation target |
No calculation target |
No calculation target |
| Category 15 | Investments | No calculation target |
No calculation target |
No calculation target |
No calculation target |
No calculation target |
Scope of calculation: Non-consolidated and our group companies *including our group companies from FY2022 onward
Our group companies consist of our company (non-consolidated) and its domestic subsidiaries.
Calculation method: In accordance with the "Basic Guidelines for Accounting for Greenhouse Gas Emissions Throughout the Supply Chain (Ver. 2.3)" (Ministry of the Environment and Ministry of Economy, Trade and Industry, December 2017)
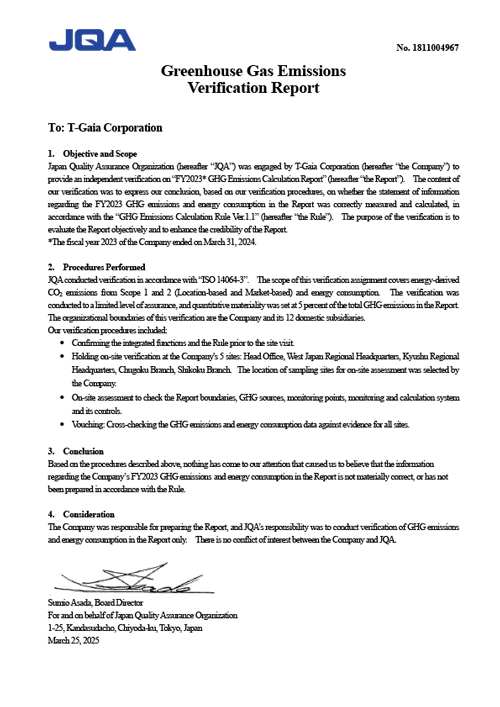
*Third-party verification has been obtained for greenhouse gas emissions (Scope 1 and 2) for FY2022 and FY2023.
Energy Use per Basic Unit
(KL/m2)
| FY2020 | FY2021 | FY2022 | FY2023 | FY2024 | |
|---|---|---|---|---|---|
| Energy use per basic unit | 0.04328 | 0.04295 | 0.04179 | 0.03671 | 0.03736 |
*Calculated based on the revised Energy Conservation Act from FY2023.
Society
Number of Employees
(People)
| FY2020 | FY2021 | FY2022 | FY2023 | FY2024 | |
|---|---|---|---|---|---|
| Number of employees (male) | 2,308 | 2,292 | 2,496 | 2,412 | 2,273 |
| Number of employees (female) | 2,361 | 2,290 | 2,426 | 2,240 | 2,150 |
Rate of Women in Management Positions
(%)
| FY2020 | FY2021 | FY2022 | FY2023 | FY2024 | |
|---|---|---|---|---|---|
| Rate of women in management positions | 9.9 | 10.7 | 11.3 | 13.0 | 16.3 |
*As of the month of initial promotion in the following fiscal year
Average Age
(Age)
| FY2020 | FY2021 | FY2022 | FY2023 | FY2024 | |
|---|---|---|---|---|---|
| Average age (male) | 38.66 | 39.3 | 39.85 | 40.61 | 40.33 |
| Average age (female) | 35.1 | 35.79 | 36.56 | 37.68 | 37.83 |
Average Years of Employment
(Years)
| FY2020 | FY2021 | FY2022 | FY2023 | FY2024 | |
|---|---|---|---|---|---|
| Average years of employment (male) | 10.6 | 11.28 | 11.65 | 12.32 | 12.25 |
| Average years of employment (female) | 8.29 | 9.08 | 9.63 | 10.47 | 10.83 |
Average Annual Salary
(Yen)
| FY2020 | FY2021 | FY2022 | FY2023 | FY2024 | |
|---|---|---|---|---|---|
| Average annual salary | 4,786,248 | 5,000,058 | 4,973,990 | 5,098,122 | 5,427,123 |
Gender Wage Gap
(%)
| FY2020 | FY2021 | FY2022 | FY2023 | FY2024 | |
|---|---|---|---|---|---|
| Gender wage gap | — | — | 73.6 | 72.5 | 77.5 |
Newly Hired Employees (New Graduates)
(People)
| Joined in FY2020 | Joined in FY2021 | Joined in FY2022 | Joined in FY2023 | Joined in FY2024 | |
|---|---|---|---|---|---|
| Number of new graduate hires (male) GS + PS positions | 42 | 28 | 6 | 4 | 15 |
| Number of new graduate hires (female) GS + PS positions | 114 | 124 | 16 | 9 | 28 |
Employee Turnover (New Graduates)
(People)
| Joined in FY2020 | Joined in FY2021 | Joined in FY2022 | Joined in FY2023 | Joined in FY2024 | |
|---|---|---|---|---|---|
| Employee turnover (new graduates) GS positions + PS positions | 10 | 13 | 1 | 1 | 6 |
Employment Rate of Persons with Disabilities
(%)
| FY2020 | FY2021 | FY2022 | FY2023 | FY2024 | |
|---|---|---|---|---|---|
| Employment rate of persons with disabilities | 2.6 | 2.5 | 2.6 | 2.7 | 2.5 |
*As of the start of the following fiscal year
Percentage of Male Workers Taking Advantage of Parenting Leave
(%)
| FY2020 | FY2021 | FY2022 | FY2023 | FY2024 | |
|---|---|---|---|---|---|
| Including our own leave system “Ikumen Support Leave System” | — | — | 80.9 | 70.6 | 80.3 |
Overtime Hours
(Hours)
| FY2020 | FY2021 | FY2022 | FY2023 | FY2024 | |
|---|---|---|---|---|---|
| Average monthly overtime hours | 18.3 | 12.7 | 12.7 | 12.4 | 13.2 |
Status of Paid Leave Utilization
(Days)
| FY2020 | FY2021 | FY2022 | FY2023 | FY2024 | |
|---|---|---|---|---|---|
| Average annual paid leave taken | 12 | 13 | 15 | 15 | 13.5 |
(%)
| FY2020 | FY2021 | FY2022 | FY2023 | FY2024 | |
|---|---|---|---|---|---|
| Number of paid vacations taken per year / Number of paid vacations granted | 68.2 | 70.6 | 81.3 | 81.3 | 72.6 |
Governance
Compliance
(%)
| FY2020 | FY2021 | FY2022 | FY2023 | FY2024 | |
|---|---|---|---|---|---|
| Compliance training participation rate | 100 | 100 | 100 | 100 | 100 |